
Systat Software
Data Management Solutions and Software
Systat Software Inc (SSI) offers enterprise level data management solutions through in-house development and various business and technology alliances with leaders in bioinformatics, cheminformatics and labinformatics industries.
Subscribed
You have successfully submitted your enquiry. Someone from our company will respond ASAP
About Us

Systat Software Inc (SSI) offers enterprise level data management solutions through in-house development and various business and technology alliances with leaders in bioinformatics, cheminformatics and labinformatics industries.
SSI is now extending its current offerings of desktop data analysis software tools such as SigmaPlot and Systat to enterprise level data management solutions for application areas such as genomics, proteomics, chemical databases and ELN and LIMS applications for lab data management.
Scientific data analysis and graphing software package
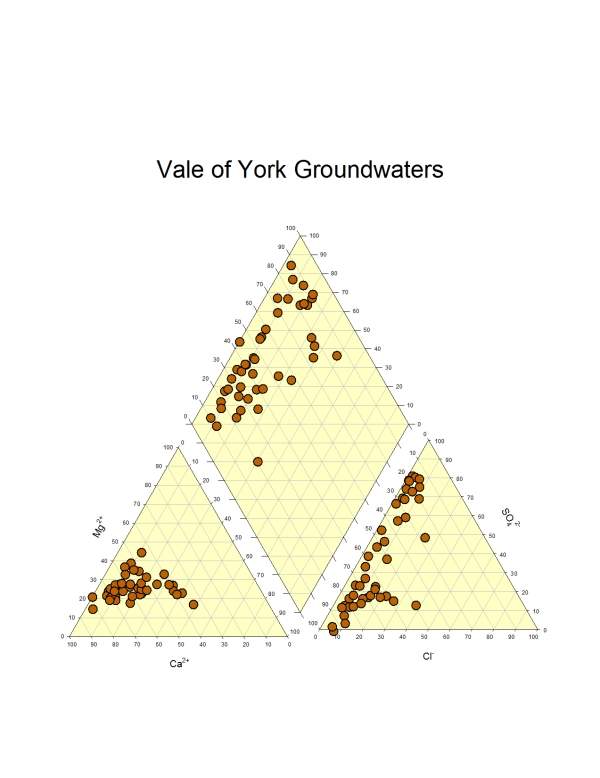
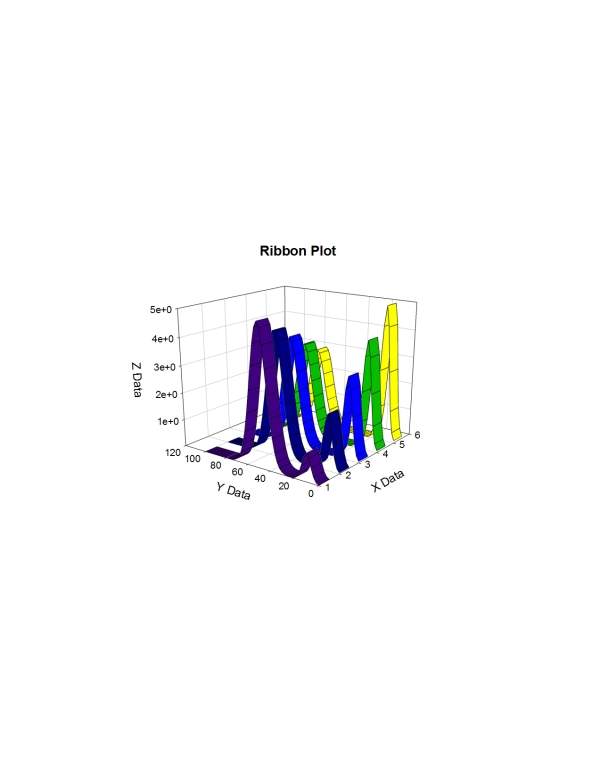
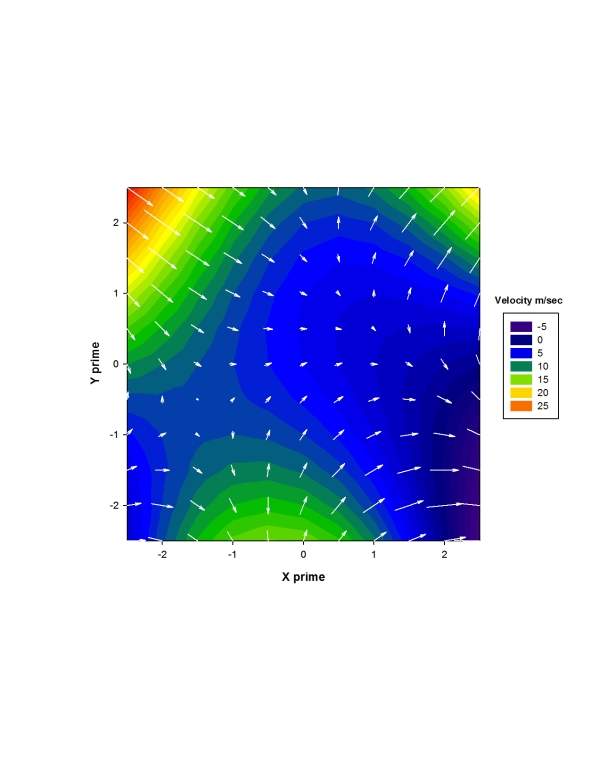
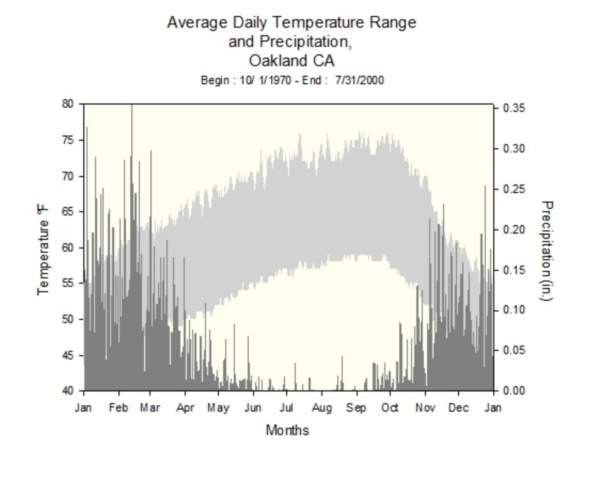
SigmaPlot® is a scientific data analysis and graphing software package with advanced curve fitting, a vector-based programming language, macro capability and more than 50 frequently-used statistical tests. SigmaPlot has the analytical features necessary to extract the important information from your research data. With more than 100 graph types and a user interface which enables detailed manipulation of every graph object, you can create the exact graph to present your results. The beauty and utility of SigmaPlot is its ability to modify each graph object to produce a graph that comprehensively ‘tells the story’ of your research.
New property browser
All the properties for a graph and its objects are contained in the property browser. You select and modify the properties there and the ‘dynamic update’ feature updates the graph immediately – you don’t have to click ‘Okay’. For example, the graph to the right shows the properties for a diagonal-gradient bar fill starting from red and ending at blue with transparency used for both colours. Property group styles may be copied and applied across like groups, thus simplifying property specification.
Easy-to-use graphing software
Create compelling graphs for publications, presentations and reports by using the Interactive Graph Wizard, which leads you through every step of graph creation. Users can choose from more than 100 different 2D and 3D graph types, and control and customise the properties of every graph element using the dynamic update. The system can even draw your graph immediately after a property change.
Data analysis methods to uncover information in your data
Sigmaplot contains more than 50 of the most frequently-used statistical tests with step-by-step directions. Fit your data easily and accurately with the Regression Wizard, Dynamic Fit Wizard and Global Fit Wizard, which allows the user to fit implicit functions and plot mathematical functions with the function plotter. Use the Macro recorder to automate repetitive and complex tasks.
New analysis features: enzyme kinetics and curve-fitting features
The Enzyme Kinetics module is now integrated into SigmaPlot, providing you with additional enzyme kinetics analysis features and additional graph types such as Michaelis-Menten, Lineweaver-Burk, Eadie-Hofstee, Scatchard, Hanes-Woolf, Hill and Dixon. Curve-Fitting features parameter covariance matrix and confidence intervals have been added to nonlinear regression reports. The Implicit function curve fitting enables the software to compute predicted values that are defined implicitly by the fit model.
Statistics and transform language
Some popular statistical tests include non-parametric one sample t-test, deming regression method comparison (account for error in both x and y), normal distribution comparison, parallel line analysis and Bland-Altman graph and statistics for method comparison. Row and column titles may now be set with a transform language statement and new functions for root-finding and equation solving, which includes a function to help solve fit models that are defined implicitly, are also installed on the system.
Contact Details
Website
Email Address
Address
50 Salisbury Road,
Hounslow,
TW4 6JQ,
Middlesex,
United Kingdom