Intelligent Quantifier
The Bio Image Intelligent Quantifier (IQ) is a software system for analyzing scanned images of 1-D and 2-D electrophoresis separations, blots, and colonies/plaques. Using the IQ software you can analyze gel files obtained from protein, DNA, RNA, or blot samples and report the data.
General Features
- Analyze protein, DNA, RNA, carbohydrate, colony & blot samples
- Analyze wet gels, dry gels, autorads, blots or photographs
- Import TIFF, JPEG, or BMP files
- Display intensity in optical density (OD)
- Name an individual band, spot, cell, or colony
- Illustrate images with circles, arrows, boxes, and text; combine an image with text for publication-quality work
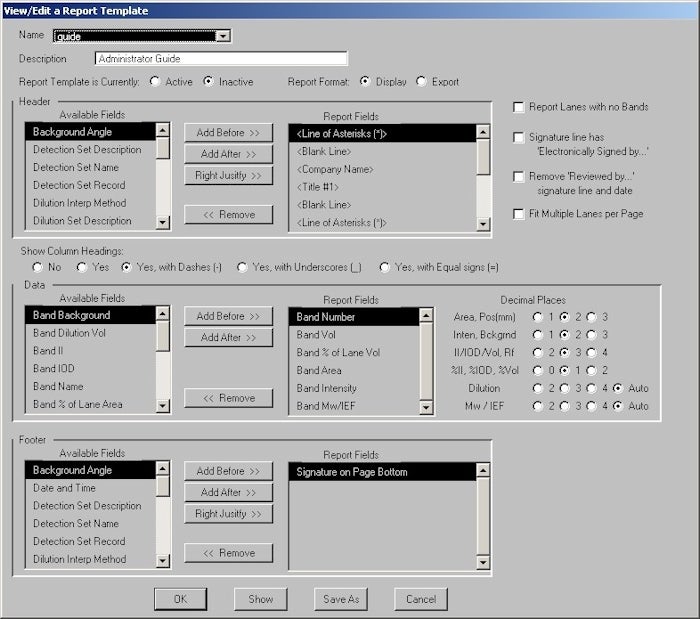
- Generate band, spot, colony and blot data analysis reports
- Export images and/or analysis in standard TIFF, JPEG, Postscript®, and ASCII formats
- Comprehensive on-line User’s Manual
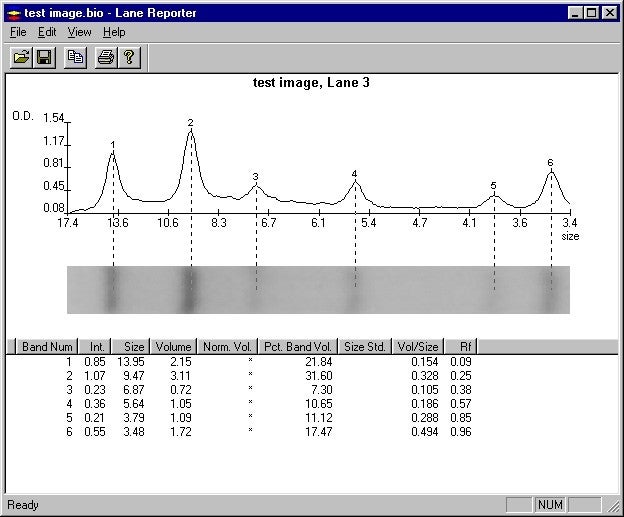
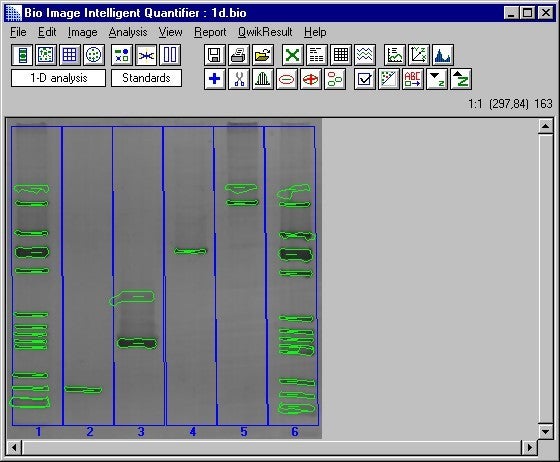
1-D Electrophoresis Analysis
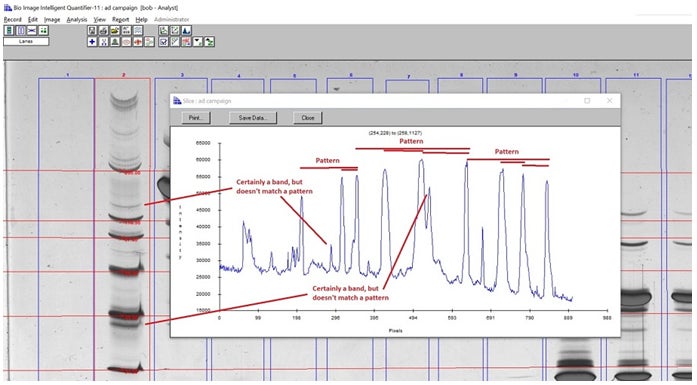
- Automatically detect lanes and find bands
- Find irregularly shaped bands, i.e., biphasic bands, “smiling bands,” or saturated bands that are substantially wider than the rest of the lane
- Vary band detection sensitivity to optimize performance to gel characteristics
- Quantify bands with actual band boundaries based on inflection point analysis
- User-specified Logarithmic, Linear, or Reciprocal methods of interpolation for standards
- Side-by-side lane profile and band size/quantification comparisons
2-D Electrophoresis Analysis
- Automatically identify spots in a user-defined area
- Analyze very complex (10,000 spots) gels
- Quantify spots using 36 radians per spot for accurate and reproducible quantification data
- Local background for each spot
- Logarithmic or Linear interpolation of Mw and pI standards
Dot/Slot Blot Analysis
- Dot and Slot Blot samples from 1 row by 1 column, up to 52 rows by 52 columns
- Automatic quantification of individual blot cells
- Automatic or manual background
- Normalize cells to a specified row, column, or cell
- Concentration standards can be assigned to user-selected cells
Colonies/Plaques
- Count colonies in a user-defined area
- Analyze very complex (10,000 colonies) samples
- Determine local background for each colony