


Cell and gene therapy patent publications totalled 9,786 in the 12 months to May 2026, a decline of approximately 25% from the prior year period. Grant ratio (the share of applications that convert to granted patents) has improved from 0.30 in the prior year to 0.35 in the TTM period. Volume is contracting and quality is improving simultaneously. The IP race is not slowing; it is concentrating, and the companies and disease areas building within that concentration are not yet visible in any public disclosure.

A sector filing more selectively
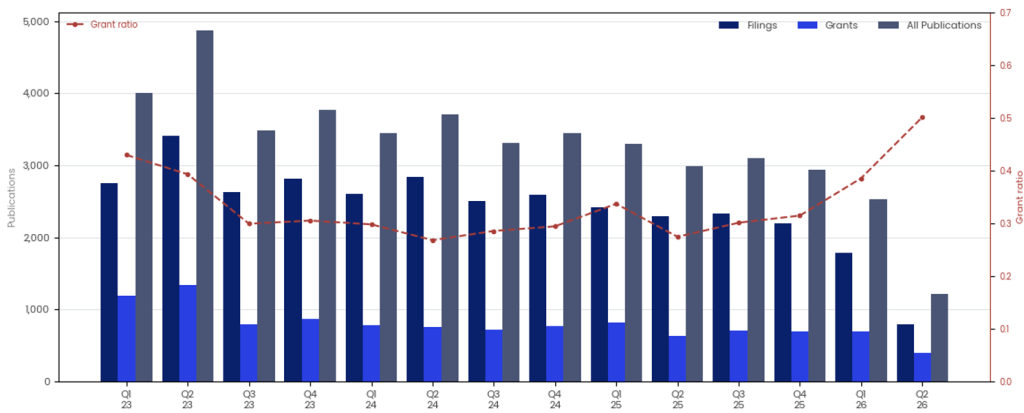
Cell and gene therapy patent activity peaked at 4,878 publications in Q2 2023. The TTM quarterly run rate of 2,447 is 49.8% below that peak. The grant ratio of 0.349 against a prior year of 0.298 reflects a sector converting applications to granted patents at a higher rate than before. That shift signals that the IP entering the pipeline is stronger, more novel, and more likely to achieve commercial protection. Johnson & Johnson (NYSE: JNJ), with H2 publications of 49 up 14.0% from 43 in H1, is the clearest positive commercial signal in the assignee data.
Figure 1: Cell and Gene Therapy Patent Publications and Grant Ratio — Quarterly, Q1 2023 to Q2 2026
Source: GlobalData Patent Analytics
The disease-level signal the aggregate hides
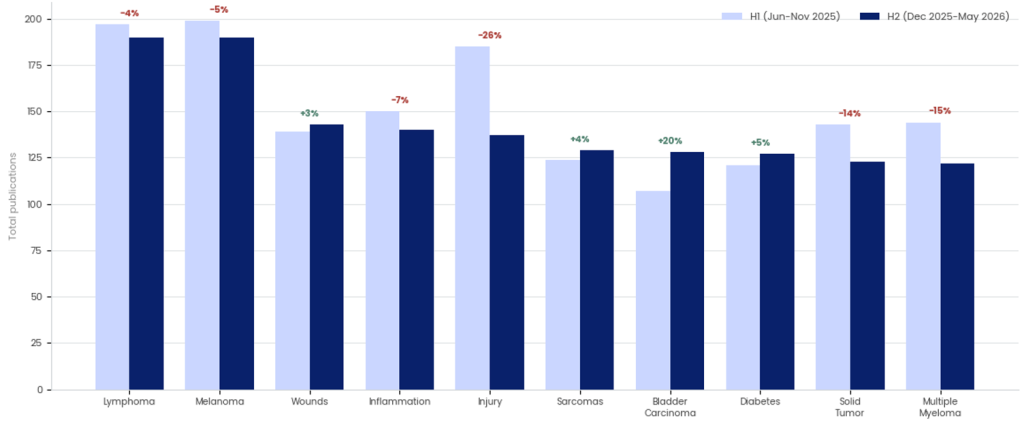
Therapy area data across the 12 months to May 2026 shows a cross-sectional range that makes the aggregate decline analytically incomplete. Multiple Myeloma fell 15.3% from H1 to H2 of the trailing twelve months. Injury fell 25.9%. Solid Tumor fell 14.0%. Each of these areas posted higher volumes in the first six months than the last six.
Against that contraction, Bladder Carcinoma grew 19.6% from H1 to H2, the strongest momentum of any tracked indication in the period. Diabetes grew 5%. Wounds and Sarcomas each grew 3% to 4%. For a portfolio with exposure to oncology or metabolic disease, this is where the IP data diverges most sharply from what consensus currently prices. Bladder Carcinoma’s acceleration signals continued pipeline investment in cell therapy and immune checkpoint research ahead of any commercial announcement. The product launches that follow this IP build will not be a surprise to anyone reading this data today.
Figure 2: Cell and Gene Therapy Patent Publications by Therapy Area/Indication — H1 vs H2, TTM Jun 2025 to May 2026
Source: GlobalData Patent Analytics
Johnson & Johnson accelerates. Sanofi and academic institutions aren’t
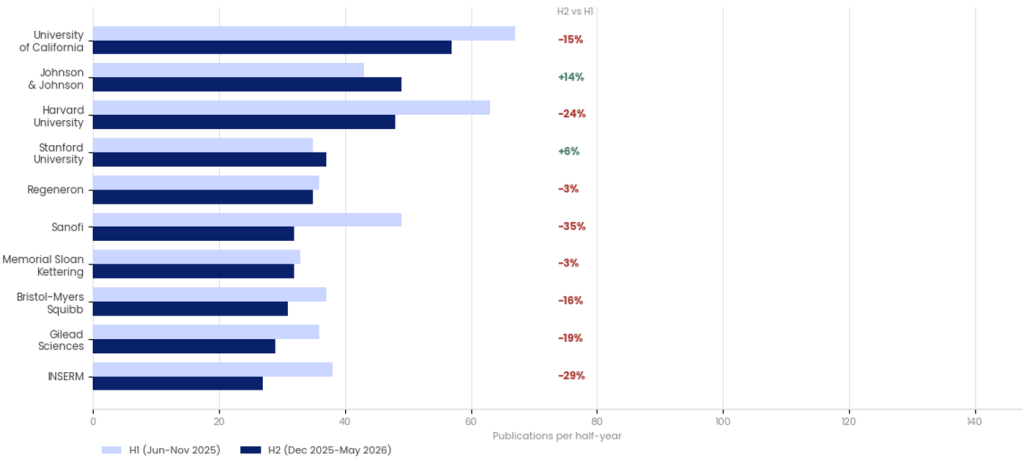
Assignee data separates the commercial operators building IP positions from those contracting. Johnson & Johnson (NYSE: JNJ) leads commercial operator growth with H2 publications of 49, up 14.0% from H1. Its disease concentration tells you what it is building: 19 publications in Multiple Myeloma and 16 in Diabetes within the TTM period. Stanford University (unlisted) grew 5.7% to 37 publications in H2, the only academic institution in the top ten recording positive momentum.
Sanofi (EPA: SAN / NASDAQ: SNY) fell 34.7% from H1 to H2. The disease context matters here: Sanofi’s patent estate in this dataset is concentrated in spinal cord injury and neuromuscular disease categories including spinal muscular atrophy, ALS, and related conditions, with 18 to 21 publications per indication. The retreat is more likely a programme maturation signal than a sector exit. University of California (unlisted) fell 14.9%, Harvard University (unlisted) fell 23.8%, and INSERM (French government, unlisted) fell 28.9%. Regeneron Pharmaceuticals (NASDAQ: REGN) held broadly flat at -2.8%, with a portfolio concentrated in deafness, Multiple Myeloma, and autoimmune conditions. Bristol-Myers Squibb (NYSE: BMY) fell 16.2% and Gilead Sciences (NASDAQ: GILD) fell 19.4%.
Figure 3: Cell and Gene Therapy Patent Publications by Assignee — H1 vs H2, TTM Jun 2025 to May 2026
Source: GlobalData Patent Analytics
Conversion gaps no volume figure can explain
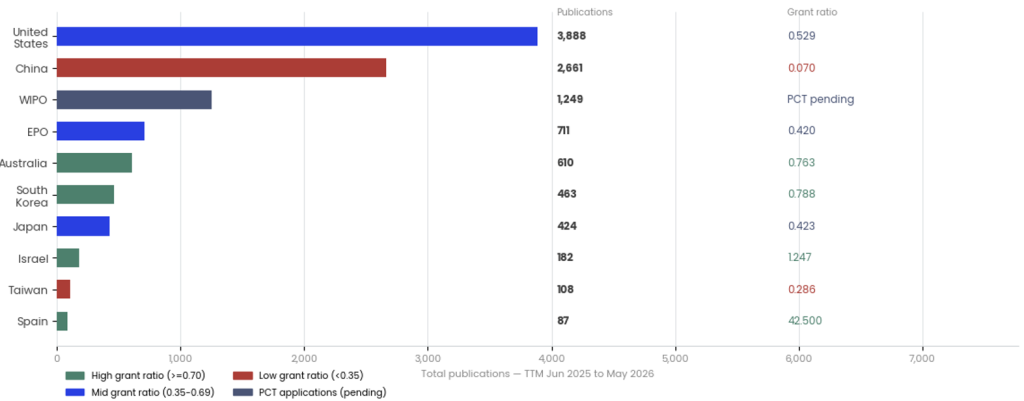
The United States leads by volume at 3,888 publications, 39.7% of TTM total, at a grant ratio of 0.529. Israel, with 182 publications, converts at 1.247: 12.5 granted patents per 10 applications. South Korea converts at 0.788, Australia at 0.764. China, with 2,661 publications, converts at 0.070, the lowest in the dataset by a wide margin. WIPO carries 1,249 publications pending national phase entry.
An investor sizing exposure to cell and gene therapy across geographies will find the grant ratio ranking more useful than the volume ranking: South Korea and Israel are building the kind of defensible commercial IP estates that precede licensing activity and partnership announcements. China’s volume share (27.2%) overstates its commercial IP position by a factor of roughly four relative to its grant ratio (0.070). 2,486 applications producing 175 grants reflects government and academic filing programmes oriented toward activity targets, not granted protection.
Figure 4: Cell and Gene Therapy Patent Publications by Patent Authority with Grant Ratio — TTM Jun 2025 to May 2026
Source: GlobalData Patent Analytics
Drug delivery and cell reprogramming converting above average
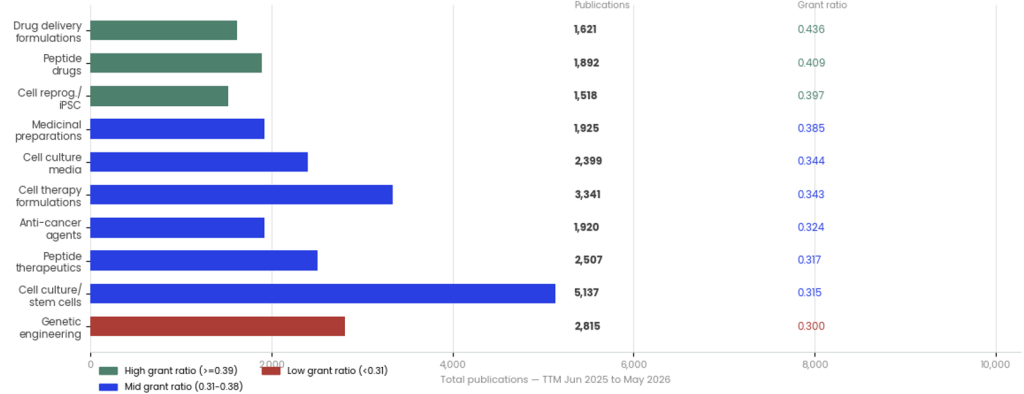
Technology classification data shows where the IP race is resolving and where it remains open. Drug delivery formulations convert at 0.436, the highest in the top ten classifications and above the sector average of 0.349. Peptide drugs convert at 0.409. Cell reprogramming and iPSC technologies convert at 0.397, placing them third in the quality ranking. These categories are where granted protection is accumulating and competitive moats are forming.
Genetic engineering and gene editing converts at 0.300, the lowest in the top ten. At 2,815 publications it is also one of the highest-volume classifications. High volume and low conversion in the same category means active competition, multiple filers, and no single organisation or geography yet dominant. For an investor evaluating platform technology exposure, this distinction, settled IP versus contested IP, is a more precise input than category-level revenue forecasts. The gene editing IP race remains fully open.
Figure 5: Cell and Gene Therapy Patent Publications by CPC Classification with Grant Ratio — TTM Jun 2025 to May 2026
Source: GlobalData Patent Analytics
The evidence that this leads to outperformance
The interval between these patent signals and their appearance in product launches or earnings guidance is where position sizing decisions get made. Companies identified as innovation leaders through patent indicators show 1.4 times higher revenue growth than the broader market.
The full evidence for how patent indicators convert into systematic outperformance across sectors and cycles is set out in GlobalData’s ‘Extracting Innovation Alpha Using Patents’, available to download for free below. 5% to 7% annualised alpha over the S&P 500 and 6% to 9% against innovation benchmarks (MSCI World Technology, Nasdaq Composite) across seven years, and portfolios outperforming 85% of the time.
Download the free report below or request a data sample by contacting hirendra.vikram@globaldata.com to start translating complex patent activity today.
